CellCharter Analysis
Introduction
IMPORTANT
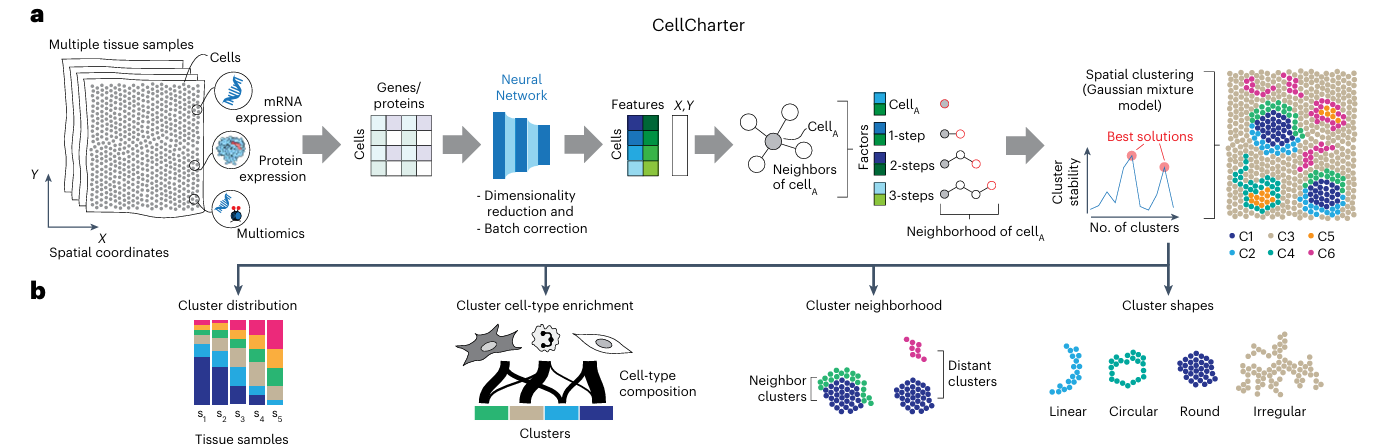
CellCharter is a specialized tool for spatial transcriptomics data analysis, revealing spatial interaction patterns of cells in tissues through neighborhood enrichment analysis. It can identify spatial colocalization relationships between cell types, providing important clues for understanding tissue microenvironments and intercellular communication.
In spatial transcriptomics research, we are not only concerned with gene expression patterns but also hope to understand the spatial distribution patterns and interactions of cells. By constructing spatial networks and calculating neighborhood enrichment scores, CellCharter can quantitatively analyze spatial proximity between cell types, providing an important tool for parsing tissue structure and function.
Core Functions of CellCharter
- Spatial Network Construction: Build spatial proximity networks based on cell or spot spatial coordinates
- Neighborhood Enrichment Analysis: Calculate the degree of spatial colocalization between cell types
- Differential Spatial Analysis: Compare changes in cell spatial distribution under different conditions
- Visualization Display: Provide intuitive heat maps to display spatial interaction patterns
This document aims to provide a comprehensive CellCharter technical guide for spatial transcriptomics researchers, covering its basic principles, operation methods on the SeekSoul™ Online platform, result interpretation, practical cases, and common questions, helping you quickly master and apply this tool.
CellCharter Theoretical Basis
Core Principles
The core idea of CellCharter is: to quantitatively analyze spatial colocalization relationships between cell types by constructing spatial networks and calculating neighborhood enrichment scores. This process can be summarized in the following main steps:
- Spatial Network Construction: Construct spatial proximity networks based on cell or spot spatial coordinates
- Neighborhood Enrichment Calculation: Calculate the ratio of actual connections between two cell populations to random expected connections
- Enrichment Score Assessment: Evaluate the degree of spatial colocalization through neighborhood enrichment scores (NE)
- Differential Analysis: Compare changes in spatial interactions under different conditions
Key Algorithm Details
Spatial Network Construction
- Principle: Based on cell or spot spatial coordinates, construct spatial proximity networks using Delaunay triangulation
- Method: Treat each cell or spot as a network node, determine connections between nodes based on spatial distance
- Advantage: Can accurately reflect the true spatial relationships of cells in tissues
Neighborhood Enrichment Analysis
- Observed Value: Actual number of connections between two cell populations
- Expected Value: Random expected number of connections based on node degrees
- Neighborhood Enrichment Score: NE = Observed/Expected
- Interpretation:
- NE > 1: Indicates spatial enrichment (colocalization) between cell populations
- NE < 1: Indicates spatial exclusion (segregation) between cell populations
- NE = 1: Indicates random spatial distribution between cell populations
Differential Neighborhood Enrichment Analysis
- Principle: Compare neighborhood enrichment analysis results under different conditions (e.g., healthy vs. disease)
- Method: Calculate differential neighborhood enrichment scores
- Statistical Testing: Calculate P-values through random sampling of condition labels to evaluate the significance of differences
Biological Significance
Tissue Microenvironment Resolution
- Function: Identify functional regions and intercellular interactions in tissues
- Application: Understand biological processes such as tissue development and disease progression
Cell Communication Research
- Function: Reveal communication mechanisms between cells through spatial proximity
- Application: Study cell signal transduction and regulatory networks
SeekSoul™ Online Platform Operation Guide
On the SeekSoul™ Online platform, the CellCharter analysis workflow is designed to be intuitive and user-friendly. You don't need to write code; you can complete the analysis through the parameter configuration interface.
Preparation Before Analysis
IMPORTANT
The success of CellCharter analysis largely depends on the quality of input data and the accuracy of spatial information. Before starting the analysis, please make sure:
- Data has been preprocessed: Your spatial transcriptomics data has undergone standard quality control, dimensionality reduction, clustering, and cell type annotation.
- Spatial coordinate information is complete: Ensure each cell or spot has accurate spatial coordinate information.
- Cell type annotation is accurate: The accuracy of cell type annotation directly affects the results of neighborhood enrichment analysis.
Parameter Details
The following table details the main parameters of the CellCharter analysis module on the SeekSoul™ Online platform.
| Interface Parameter | Description |
|---|---|
| Task Name | The name of this analysis task, must start with an English letter, and can include English letters, numbers, underscores, and Chinese characters. |
| Grouping.by | Column name in meta, e.g., CellAnnotation, required. |
| Cell Type | Object corresponding to the col_celltype column in meta, required. |
| Filtering.by | Column name in meta, e.g., Sample, required. |
| Filtering | Object corresponding to the col_sam column in meta, required. |
| Group.by | Column name in meta, e.g., group, required. |
| Group Names | Object corresponding to the col_group column in meta, required. |
| Note | Custom remark information. |
Important Notes
CAUTION
- Spatial Coordinate Requirements: Ensure spatial coordinate information is accurate and complete; missing or incorrect coordinate information will lead to analysis failure.
- Cell Type Selection: Select biologically meaningful cell types for analysis; avoid selecting types with too few cells.
- Sample Quality Control: Ensure sample quality is good; low-quality samples will affect the accuracy of spatial network construction.
Operation Process
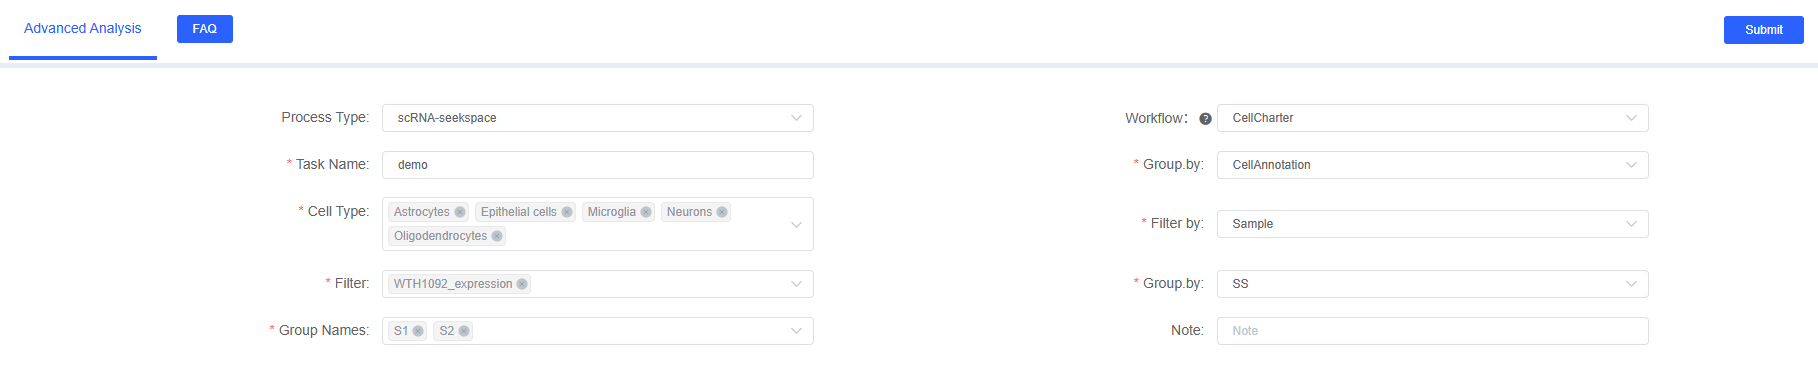
- Enter Analysis Module: Navigate to the "Advanced Analysis" module on the SeekSoul™ Online platform, select "CellCharter".
- Create New Task: Name your analysis task and select the sample or project to analyze.
- Configure Parameters: According to the above guidelines, select the cell types, grouping information, etc., to analyze.
- Submit Task: After confirming the parameters are correct, click the "Submit" button and wait for the analysis to complete.
- Download and View: After analysis is complete, download and view the generated analysis report and result files in the task list.
Result Interpretation
CellCharter's analysis report contains rich charts and data files. The following is a detailed interpretation of the core results.
Result File List
| File Name | Content Description |
|---|---|
*_enrichment_heatmap.png | Cell type neighborhood enrichment heatmap (PNG format) |
*_enrichment_heatmap.pdf | Cell type neighborhood enrichment heatmap (PDF format) |
*_enrichment_heatmap.txt | Neighborhood enrichment score data table |
Neighborhood Enrichment Heatmap Interpretation
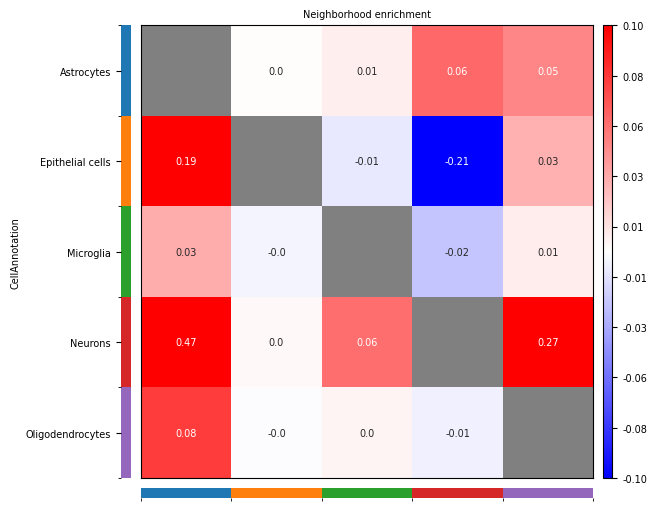
Heatmap Structure
- Rows: Source cell types (Ci)
- Columns: Target cell types (Cj)
- Values: Neighborhood enrichment scores (NE)
Color Meanings
- Positive Numbers (Red): Indicate cell populations Ci and Cj tend to be enriched spatially, i.e., more likely to be adjacent
- Negative Numbers (Blue): Indicate cell populations Ci and Cj tend to be excluded spatially, i.e., more likely to be separated
- Zero (White): Indicate the number of connections between cell populations Ci and Cj is consistent with random expectations, no obvious enrichment or exclusion
Biological Explanation
- Spatial Enrichment: Suggests two cell types may have functional relevance, such as intercellular communication, synergistic effects, etc.
- Spatial Exclusion: Suggests two cell types may have functional antagonism or competitive relationships
- Random Distribution: Suggests two cell types are spatially independent
Data Table Interpretation
The neighborhood enrichment score data table contains the following information:
- Row Names: Source cell types
- Column Names: Target cell types
- Values: Corresponding neighborhood enrichment scores
Application Cases
Case One: CellCharter Method Performance Comparison Analysis
- Literature: Varrone, M., Tavernari, D., Santamaria-Martínez, A. et al. Nature Genetics. 2024.
- Background: Researchers used human dorsolateral prefrontal cortex (DLPFC) Visium datasets to compare the performance of CellCharter with other spatial clustering methods.
- Analysis Strategy: Use adjusted Rand index (ARI) to evaluate the performance of different methods in spatial clustering tasks, including DR.SC, SOTIP, SEDR, BayesSpace, STAGATE, UTAG, and other methods.
- Core Findings:
- CellCharter performed best among all comparison methods, with an average ARI reaching 0.62, significantly better than other methods.
- CellCharter showed excellent performance in both GPU and CPU environments.
- Statistical tests verified the significant advantages of CellCharter over other methods.
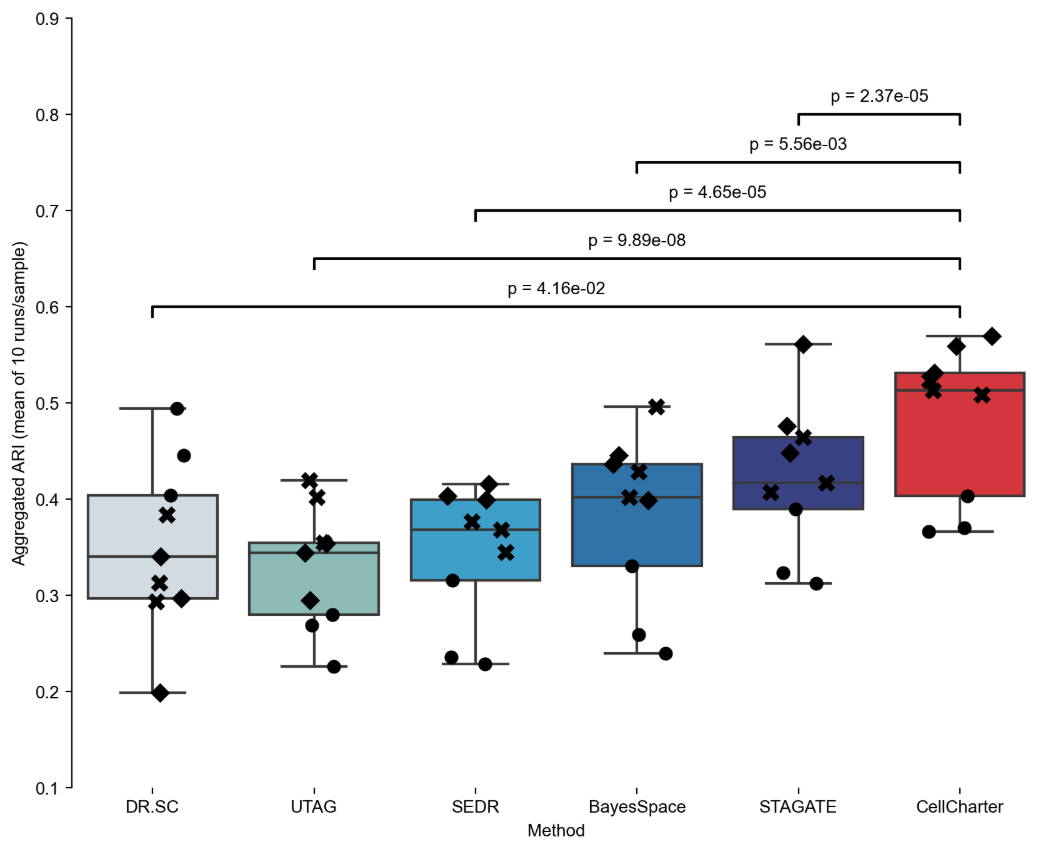
Figure: Performance comparison of CellCharter with other spatial clustering methods. The box plot shows that CellCharter performed best among all methods, with an average ARI significantly higher than other methods. The figure also shows individual performance of different patient samples (represented by different markers).
Case Two: Spatial Clustering Analysis of Human Brain Cortex
- Literature: Varrone, M., Tavernari, D., Santamaria-Martínez, A. et al. Nature Genetics. 2024. (Fig. 1)
- Background: Use CellCharter to analyze human dorsolateral prefrontal cortex (DLPFC) Visium datasets, comparing the performance of CellCharter with other spatial clustering methods.
- Analysis Strategy: Conduct spatial clustering analysis on DLPFC samples, use adjusted Rand index (ARI) to evaluate the performance of different methods, including DR.SC, SOTIP, SEDR, BayesSpace, STAGATE, UTAG, and other methods.
- Core Findings:
- CellCharter performed best among all comparison methods, with an average ARI reaching 0.62, significantly better than other methods.
- Compared with other methods, CellCharter better captured the boundaries of cortical layers while maintaining spatial continuity.
- Through batch effect correction, CellCharter maintained consistent clustering results across different samples.
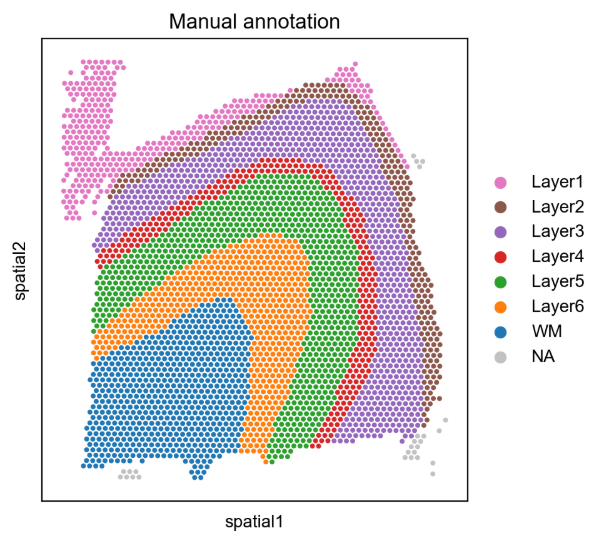
Figure: Comparison of spatial clustering results of human dorsolateral prefrontal cortex. This figure shows the spatial clustering performance of CellCharter on Visium data, which can accurately identify spatial distribution patterns of different cortical layers.
Case Three: Spatial Niche Analysis of Mouse Spleen CODEX Data
- Literature: Varrone, M., Tavernari, D., Santamaria-Martínez, A. et al. Nature Genetics. 2024. (Figs. 2-3)
- Background: Use CellCharter to analyze spatial distribution and interaction patterns of different cell types in mouse spleen CODEX data, identifying spatial niche structures.
- Analysis Strategy: Conduct spatial clustering on CODEX data, calculate cell type enrichment and neighborhood enrichment analysis, compare spatial clustering performance of CellCharter with other methods.
- Core Findings:
- CellCharter identified 11 different spatial niches, including B cell follicles, PALS regions, marginal zones, etc.
- Compared with other methods such as STAGATE, CellCharter can more clearly identify different spatial niche structures.
- Neighborhood enrichment analysis revealed spatial interaction patterns between different cell types.
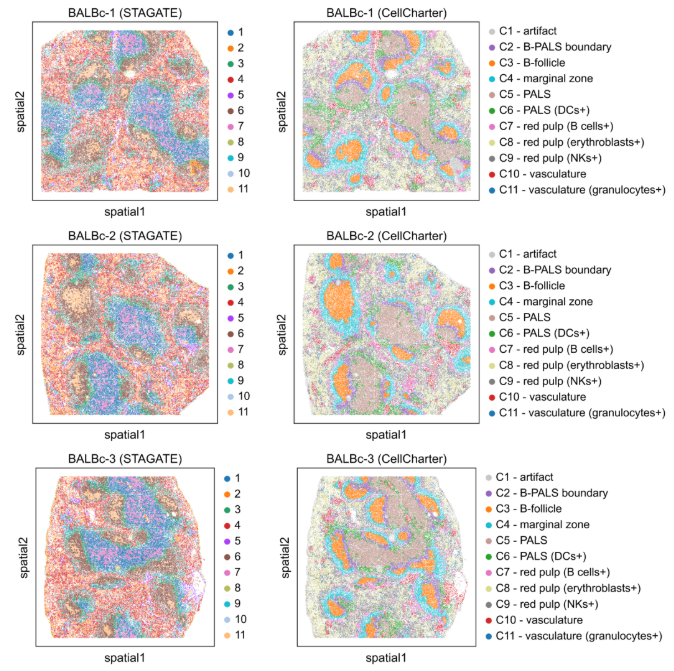
Figure: Comparison of spatial clustering results of mouse spleen CODEX data. The top panel shows results from the STAGATE method, and the bottom panel shows results from CellCharter. CellCharter can more clearly identify different spatial niches, including B cell follicles, PALS regions, etc.
Case Four: Cell Type Neighborhood Enrichment Analysis
- Literature: Varrone, M., Tavernari, D., Santamaria-Martínez, A. et al. Nature Genetics. 2024. (Based on CODEX mouse spleen data)
- Background: Use CellCharter to analyze spatial enrichment and exclusion patterns between different cell types in mouse spleen CODEX data, revealing cell-cell interactions in tissues.
- Analysis Strategy: Calculate neighborhood enrichment scores between cell types, generate enrichment heatmaps, compare spatial interaction differences under different conditions.
- Core Findings:
- Found significant spatial enrichment of B cells and T cells in PALS regions.
- Identified specific spatial distribution patterns of different immune cell subsets in the spleen.
- Differential neighborhood enrichment analysis revealed changes in spatial organization under disease states.
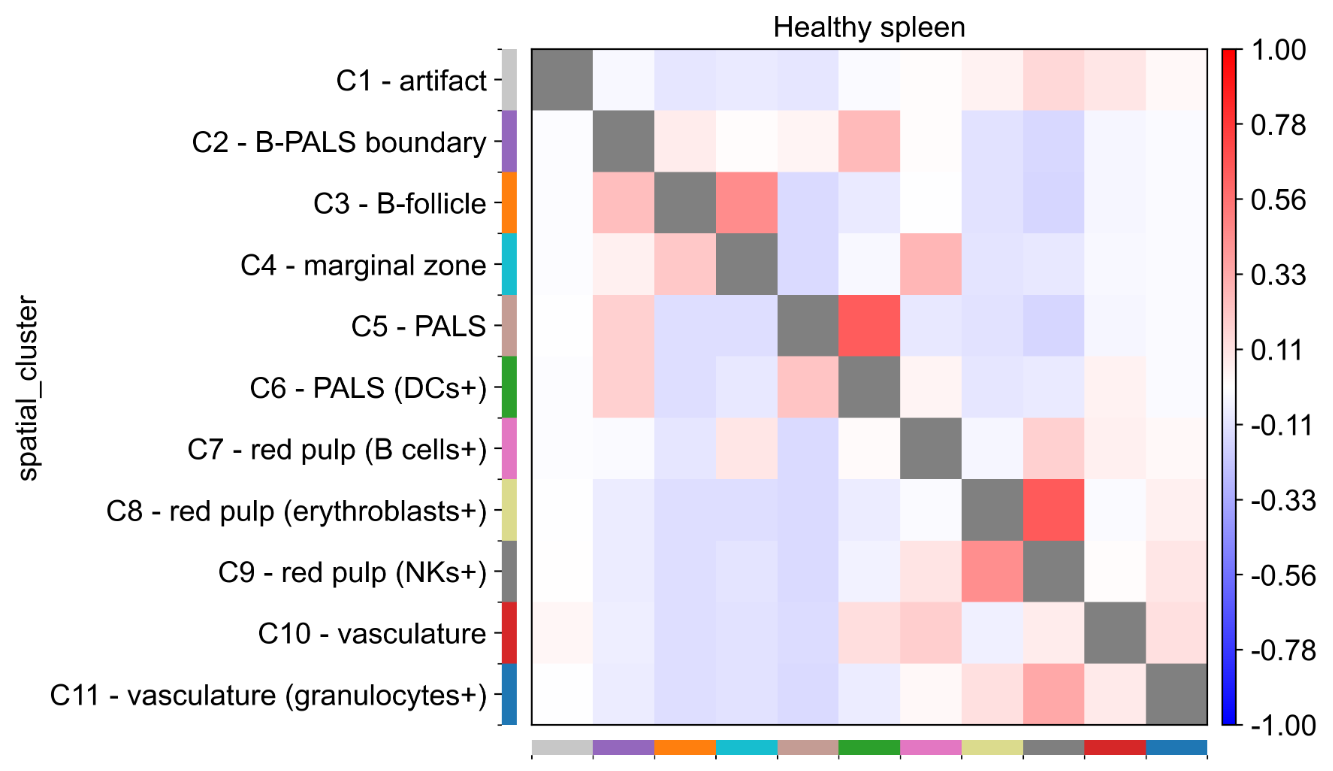
Figure: Cell type neighborhood enrichment analysis heatmap. Red indicates spatial enrichment, blue indicates spatial exclusion. It can be seen that there are complex spatial interaction patterns between different cell types, reflecting the spatial organizational structure of spleen tissue.
Notes and Best Practices
WARNING
Avoid Overinterpretation: CellCharter results are computational inferences based on spatial proximity and do not equate to true biological interactions. Any key findings require subsequent biological experiments for confirmation.
CAUTION
Data Quality is Crucial: CellCharter analysis has high requirements for the accuracy of spatial coordinate information; low-quality spatial data may lead to false positive results. Please ensure spatial coordinate information is accurate and complete.
TIP
Focus on Biological Significance: In addition to statistical significance, pay more attention to the biological functions and disease relevance of spatial interactions, and make comprehensive judgments combining functional enrichment analysis and known cell interaction knowledge.
NOTE
Results Affected by Parameters: CellCharter analysis results will be affected by the accuracy of cell type annotation and analysis parameters (such as selected cell populations, spatial network construction methods). If initial results are not ideal, you can try adjusting input parameters and re-analyzing.
Frequently Asked Questions (FAQ)
Q1: How long does CellCharter analysis take?
A: Analysis time depends on data scale and computing resource configuration. Generally speaking:
- Small datasets (1,000-5,000 cells): 30 minutes-1 hour
- Medium datasets (5,000-20,000 cells): 1-3 hours
- Large datasets (>20,000 cells): 3-8 hours or longer
Q2: What is the significance of neighborhood enrichment scores?
A:
- NE > 1: Indicates spatial enrichment of two cell types, existing colocalization relationships
- NE < 1: Indicates spatial exclusion of two cell types, mutual separation
- NE = 1: Indicates random spatial distribution of two cell types, no obvious spatial association
Q3: How to judge the biological significance of spatial interactions?
A: The biological significance of spatial interactions can be judged through the following methods:
- Functional Enrichment Analysis: Analyze whether spatially enriched cell types are functionally related
- Literature Validation: Combine known cell interaction knowledge for validation
- Differential Analysis: Compare changes in spatial interactions under different conditions
Q4: How to verify the reliability of CellCharter analysis results?
A: The reliability of results can be verified through the following ways:
- Biological Validation: Combine known literature and databases to verify key spatial interactions
- Experimental Validation: Verify spatial colocalization through immunofluorescence, in situ hybridization, etc.
- Cross-Validation: Use different datasets or analysis methods to verify result consistency
References
Varrone, M., Tavernari, D., Santamaria-Martínez, A. et al. CellCharter reveals spatial cell niches associated with tissue remodeling and cell plasticity. Nat Genet 56, 74–84 (2024). doi: 10.1038/s41588-023-01600-x.
Clark, D.J., Datar, R., Hisey, E. et al. Integrated proteogenomic characterization of clear cell renal cell carcinoma. Cell 180, 207-228.e26 (2020). doi: 10.1016/j.cell.2019.12.016.
Palla, G., Spitzer, H., Klein, M. et al. Squidpy: a scalable framework for spatial omics analysis. Nat Methods 19, 171–178 (2022). doi: 10.1038/s41592-021-01358-2.
Wolf, F.A., Angerer, P. & Theis, F.J. SCANPY: large-scale single-cell gene expression data analysis. Genome Biol 19, 15 (2018). doi: 10.1186/s13059-017-1382-0.
Palla, G., Fischer, D.S., Langen, M. et al. Squidpy: a scalable framework for spatial omics analysis. Nat Methods 19, 171–178 (2022). doi: 10.1038/s41592-021-01358-2.